|
Recorded Wealth Transfer
Table A. Annual average recorded wealth transfer, Iowa, 1998-2002 |
| |
Clarke County, Iowa |
| County |
County
rank |
State |
Annual average number of recorded probated estates, 1998-2002
(adjusted for missing probate data) |
51 |
98 |
17,976 |
| Annual average recorded wealth transfer (millions nominal $), 1998-2002 |
$9.4 |
99 |
$4,933 |
| Annual average transfer/recorded probated estate (nominal $), 1998-2002 |
$186,033 |
93 |
$274,425 |
Source: Community Vitality Center and Iowa Court Information Systems |
|
Projected Wealth Transfer
Table B. Projected wealth transfer by decade (millions nominal $ inflated at 2% annually),
Iowa, 2000-2049 |
| |
Clarke County, Iowa |
| County |
State |
millions
nominal $
inflated
at 2% per year |
percent
of
50 year transfer |
millions
nominal $
inflated
at 2% per year |
percent
of
50 year transfer |
| Projected wealth transfer, 50 years, 2000-2049 |
$886.4 |
100.0% |
$531,712.1 |
100.0% |
| Projected wealth transfer, 1st 10 years, 2000-2009 |
$107.8 |
12.2% |
$57,462.0 |
10.8% |
| Projected wealth transfer, 2nd 10 years, 2010-2019 |
$131.2 |
14.8% |
$74,427.5 |
14.0% |
| Projected wealth transfer, 3rd 10 years, 2020-2029 |
$165.4 |
18.7% |
$98,257.5 |
18.5% |
| Projected wealth transfer, 4th 10 years, 2030-2039 |
$217.3 |
24.5% |
$133,602.1 |
25.1% |
| Projected wealth transfer, 5th 10 years, 2040-2049 |
$264.6 |
29.9% |
$167,963.0 |
31.6% |
Source: Community Vitality Center |
|
Charitable Giving
Table C. Average income and charitable contributions, federal income tax returns,
Iowa, 1997* |
| All income levels |
Clarke County, Iowa |
| County |
County
rank |
State |
US |
| Total number federal tax returns filed |
3,601 |
87 |
1,317,635 |
121,697,497 |
| Number federal income tax returns with itemized contributions |
469 |
86 |
309,358 |
32,632,950 |
| Average adjusted gross income, returns with itemized contributions |
$57,403 |
80 |
$76,516 |
$89,230 |
| Average itemized contribution |
$1,620 |
91 |
$2,579 |
$2,977 |
| Average contributions as a percent of average adjusted gross income |
2.8% |
87 |
3.4% |
3.3% |
| |
| Adjusted gross income under $50,000 |
Clarke County, Iowa |
| County |
County
rank |
State |
US |
| Total number federal tax returns filed |
3,085 |
85 |
1,033,095 |
92,776,089 |
| Number federal income tax returns with itemized contributions |
226 |
87 |
118,061 |
12,085,101 |
| Average adjusted gross income, returns with itemized contributions |
$29,181 |
73 |
$32,220 |
$32,553 |
| Average itemized contribution |
$1,111 |
92 |
$1,416 |
$1,514 |
| Average contributions as a percent of average adjusted gross income |
3.8% |
85 |
4.4% |
4.7% |
| |
| Adjusted gross income over $50,000 |
Clarke County, Iowa |
| County |
County
rank |
State |
US |
| Total number federal tax returns filed |
516 |
88 |
284,540 |
28,921,408 |
| Number federal income tax returns with itemized contributions |
243 |
87 |
191,297 |
20,547,849 |
| Average adjusted gross income, returns with itemized contributions |
$83,650 |
93 |
$103,854 |
$122,564 |
| Average itemized contribution |
$2,095 |
91 |
$3,296 |
$3,837 |
| Average contributions as a percent of average adjusted gross income |
2.5% |
84 |
3.2% |
3.2% |
Source: Community Vitality Center, Urban Institute National Center for Charitable Statistics and U.S. Internal Revenue Service |
|
Income
Table D. Total per capita income and per capita income from dividends, interest
and rent, Iowa, 1990-2000 |
| |
Clarke County, Iowa |
| County |
County
rank |
State |
US |
| Per capita income (nominal $), 2000 |
$22,715 |
68 |
$26,540 |
$29,760 |
| Per capita income (nominal $), 1990 |
$14,051 |
91 |
$17,372 |
$19,572 |
| Dollar change in per capita income, 1990-2000 |
$8,664 |
39 |
$9,168 |
$10,188 |
| Percent change in per capita income, 1990-2000 |
61.7% |
7 |
52.8% |
58.6% |
| |
| Per capita income from dividends, interest, rent (nominal $), 2000 |
$3,822 |
95 |
$5,483 |
$5,663 |
| Percent of per capita income income from dividends, interest and rent, 2000 |
16.7% |
96 |
20.6% |
19.0% |
Source: Community Vitality Center and Bureau of Economic Analysis, U.S. Department of Commerce |
|
Total Population
Table E. Population, Iowa, 1990-2000 |
| |
Clarke County, Iowa |
| County |
County
rank |
State |
US |
| Population, 2000 |
9,133 |
84 |
2,926,324 |
281,421,906 |
| Population, 1990 |
8,287 |
89 |
2,776,831 |
248,709,873 |
| Population change, 1990-2000 |
846 |
27 |
149,493 |
32,712,033 |
| Percent population change , 1990-2000 |
10.2% |
8 |
5.4% |
13.2% |
Source: Community Vitality Center and U.S. Census Bureau, U.S. Department of Commerce |
|
Deaths
Table F. Deaths and death rates, Iowa, 1990-2002 |
| |
Clarke County, Iowa |
| County |
County
rank |
State |
US |
| Average annual deaths, 2000-2002 |
99 |
92 |
27,836 |
2,422,430 |
| Average annual deaths, 1995-1999 |
99 |
95 |
28,018 |
2,333,800 |
| Average annual deaths, 1990-1994 |
101 |
93 |
27,261 |
2,208,400 |
| |
| Average annual death rate/1000 population, 2000-2002 |
10.9 |
57 |
9.5 |
8.6 |
| Average annual death rate/1000 population, 1995-1999 |
11.4 |
54 |
9.7 |
8.7 |
| Average annual death rate/1000 population, 1990-1994 |
12.0 |
41 |
9.7 |
8.7 |
Source: Community Vitality Center and Iowa Department of Public Health |
|
Age
Table G. Median age and age 65 or older,
Iowa, 2000 |
| |
Clarke County, Iowa |
| County |
County
rank |
State |
US |
| Median age (years) |
38.6 |
63 |
36.6 |
35.3 |
| Number 65 or older |
1,560 |
91 |
436,213 |
34,991,753 |
| Percent 65 or older |
17.1% |
63 |
14.9% |
12.4% |
Source: Community Vitality Center and U.S. Census Bureau, U.S. Department of Commerce |
| |
Percent of population by age group, Iowa, 2000 |
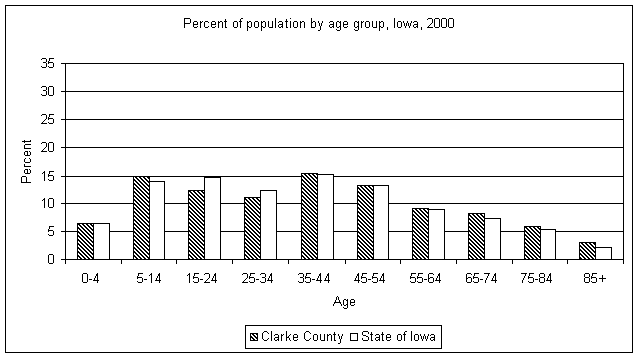 Source: Community Vitality Center and U.S. Census Bureau, U.S. Department of Commerce |
|
|